Document editing and report creation are key parts of any researcher’s workflow. Thankfully, the tools to edit research documents have improved greatly over the last few years. While I used to write most documents with $ \LaTeX $, I’d now recommend that researchers use R Markdown.
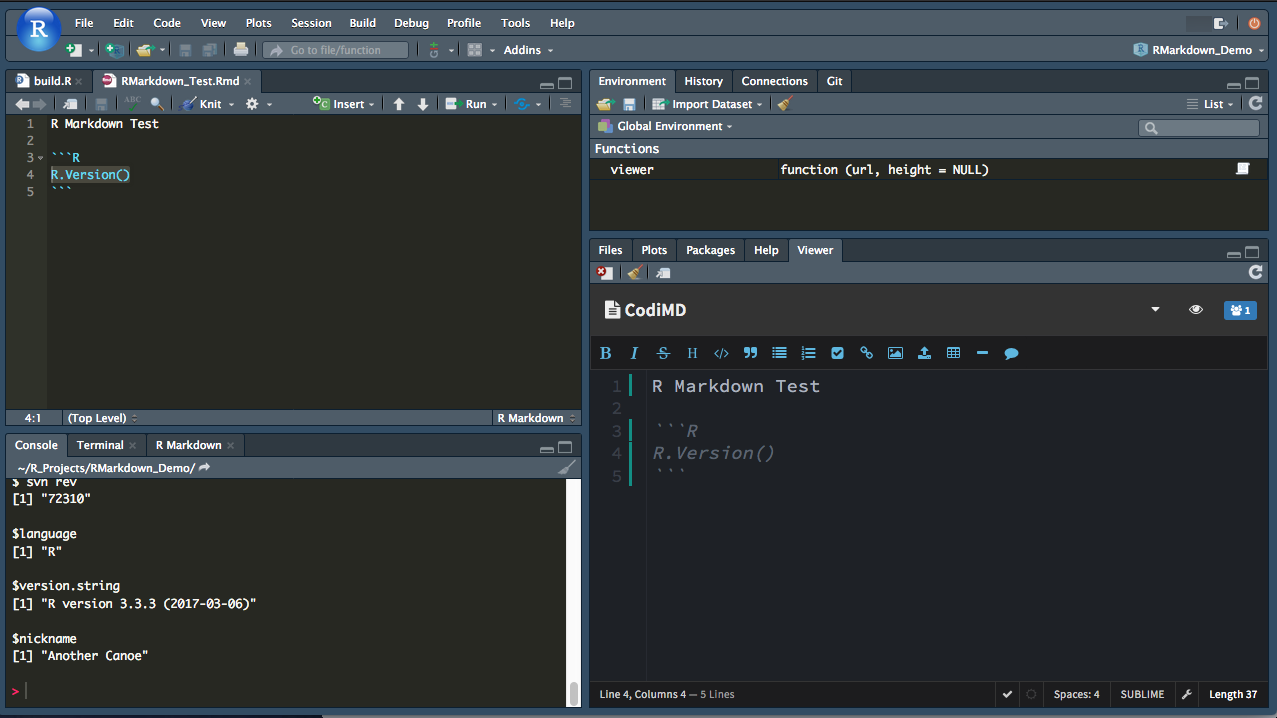
R Markdown allows the use of R code in a Markdown format and is also easily extended with features. For example, there is the excellent bookdown package which allows easy use of book formatting, bibliographies and cross-references with Markdown.
this post was previously published on my old website, there’ll be a few of those older but useful posts that I’ll be migrating over in the next little while…
Molecules are beautiful things, intricate and infinitely variable. As part of research publications it can be useful to catch them from their best angles. This short post gives some tips on how to present molecules in publications.
Our model for today is Prostaglandin-F2α There are a number of chemical databases and ways of expressing molecular identities.
Publishing fMRI results usually involves the presentation of slice images that show regions of increased BOLD (Blood Oxygen Dependent Signal). However, fMRI data is inherently three dimensional and often it is difficult to visualise or appropriately present data in 2D formats.
Therefore, it can be useful to implement a method for displaying graphics in 3D form. Luckily, there are some good javascript libraries that interact with the HTML5 canvas attribute to present 3D objects.